Posts

Showing posts from January, 2021

Format Cell Values in Excel

Image
In this blog post we will learn to “Format Cell Values” in excel. Many times while working in excel we have to use various formats like text, number, date etc. to our cells values. So here we will learn how to format our cells and how many formats are there which we can use to our cell values. First of all we will see where these various formats are available on our excel screen. For this we have to click on “Home” tab and check the “Number” group. If we click on the drop down menu as shown in below image we can see all the formats which we can use to format our cells. We will see all these formats in brief in this blog post. To change the format of a cell values, first select the respective cell and then select the desired format from the below image as per your requirement. General Format: By default “General” format is applied to excel cells. It means there is no any specific number format is applied to the cells. Number Format:  This format is used to display the numbers. For examp
Bar Charts in Excel

Image
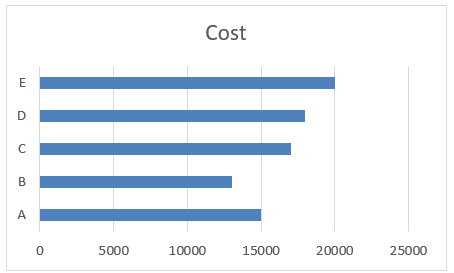
Previously we have learned about creating “ Column Charts in Excel ”. Now, in this blog post we will learn about how to create “Bar Charts in Excel”. To explain in a very simple way, we have prepared a dummy data of 05 products: Product A, Product B, Product C, Product D and Product E along with their costs. Now we have to convert this data into Bar Chart for better pictorial representation. We can do so by following below steps: 1. Select the data which we want to convert into Bar Chart. 2. Go to Insert Tab, Select Insert Bar Chart command under “Charts” group. 3. We will get further options for selecting Bar Chart. Out of these appeared option we have to select “Clustered Bar” under “2-D Bar” option as shown in below image. 4. We can see that Bar Chart is now ready for our selected data. Changing Chart Style: To change the formatting of our chart, click on the existing chart which will appear two additional tabs on our Ribbon. These tabs are: 1. Design Tab 2. Format Tab Once we clic

Insert Shapes in Excel

Image
In this blog post we will learn to Insert Shapes in excel. For this we have to click on “Insert” tab and under “Illustrations” group we can find a command “Shapes”.  Once we click on the “Shapes” command, we can see large variety of shapes which are available in excel will appear on our screen. These shapes are divided into 09 different categories: 1. Recently Used Shapes 2. Lines 3. Rectangles 4. Basic Shapes 5. Block Arrows 6. Equation Shapes 7. Flowchart 8. Stars and Banners 9. Callouts Recently Used Shapes : All the recently used shapes will appear in this category. If you are using only few shapes repetitively then you don’t need to search for those shapes in their individual category. You can easily find them in Recently Used Shapes. Lines : We can find various types of Lines, Arrows, and Connectors etc. under this category. Rectangles : We can find various types of Rectangles under this category. Basic Shapes : We can find various types of basic shapes like triangle, oval, diam

Find and Select Commands in Excel

Image
In this blog post we will see all the options available under “Find & Select” command in excel. This command is available in Home tab, under Editing group as shown in below image. To explain all the options in details we have prepared a dummy data of Sales Performance for the year 2020. In this data we have entered data of few employees as shown in below image. We have applied some formulas, Data Validation, Comments, Conditional Formatting to this data so that it will be easier for you to understand this topic. So, let’s see all these options one by one: Find:  This option will help us to find desired value in our existing data. 1. Select the sheet where our existing data is present. 2. Select the command “Find & Select” and select option “Find” from the list of available options. 3. This will open “Find and Replace” dialog box on our screen. 4. We have to provide input value for the field “Find what” which we have to find in our existing data. As an example we will enter valu