Insert SmartArt Graphic in Excel
In this blog post we will learn to insert SmartArt Graphic in excel. These SmartArt Graphics can be used to communicate information visually.

Once we click on SmartArt command, one dialog box named as “Choose a SmartArt Graphic” will appear on our excel screen.


SmartArt Command on Excel Screen:
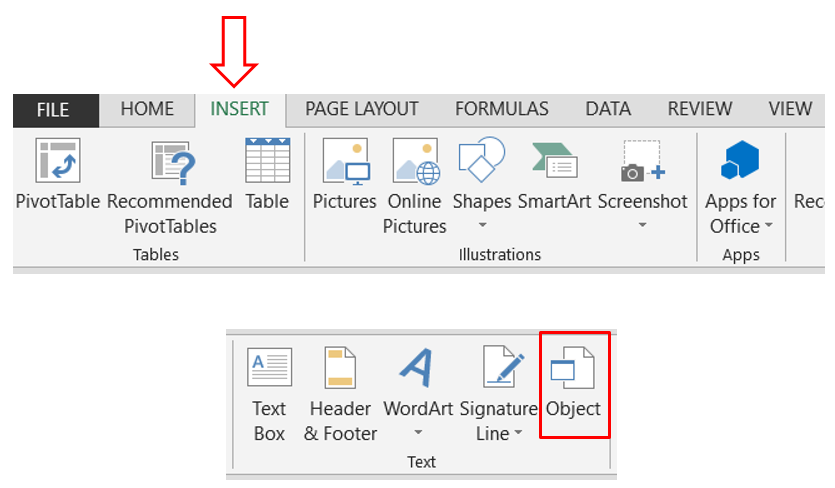
The main thing we should know is where we can find SmartArt command on our excel screen? For this we have to go to “Insert” tab and under “Illustrations” group, we can find “SmartArt” command as highlighted in below image.

All the SmartArt Graphics which are available in excel are divided in different categories. These categories we can see on the left hand side of dialog box. By default “All” category is selected, under which we can find all the SmartArt Graphics irrespective of their original category.

SmartArt Graphic Categories:
All the SmartArt Graphics are divided in various categories based on their designs. These categories are:
1. List
2. Process
3. Cycle
4. Hierarchy
5. Relationship
6. Matrix
7. Pyramid
8. Picture
9. Office.com
List:
Whenever we want to visualize the information which contains list, we can use this category. For example, if we want to show the brief information about the employees from our team then we can use this List Category.
There are variety of graphic design available under List category and you can use the right one as per your specific requirements.

Process:
Whenever we have a defined process and we want to visualize this process, we can use this category. For example, we can use this category to visualize each step in our process or workflow.
There are variety of graphic design available under List category and you can use the right one as per your specific requirements.

Cycle:
Whenever we sequence of tasks which are repetitive after one another, then to visualize such tasks we can use we can use this category. For example, we can show PDCA cycle or 5S process with the help of this category.
There are variety of graphic design available under List category and you can use the right one as per your specific requirements.

Hierarchy:
With this category, we can visualize hierarchy or reporting structure. For example, we can visualize Organization Chart with the help of this category.
There are variety of graphic design available under List category and you can use the right one as per your specific requirements.

Relationship:
Whenever we want to connect various ideas, thoughts with one another or sometimes we want to compare the two ideas then Relationship category can be used.
For example, we have two different ideas and among these two we want to choose the best idea for implementation. In this case, we can visualize all the aspects for both the ideas and compare them which will help us to choose the best idea.
There are variety of graphic design available under List category and you can use the right one as per your specific requirements.

Matrix:
Whenever we want to show the relationship of a four quadrants to a single activity then we can use this category.
There are variety of graphic design available under List category and you can use the right one as per your specific requirements.

Pyramid:
Whenever we want to visualize the relationships in ascending or descending order then we can use this category.
There are variety of graphic design available under List category and you can use the right one as per your specific requirements.

Picture:
We can also add picture in SmartArt Graphic to give special effects to our visualization. All such SmartArt graphics are available under this category and you can use the right one as per your specific requirements.

Office.com:
You can use the right one as per your specific requirements from the designs.

Example: Inserting Basic Cycle SmartArt Graphic
Now, in this section we will insert one SmartArt Graphic. For example, we have 05 tasks which are repetitive and we have to execute them one after another. We will name these tasks as Task 1, Task 2, Task 3, Task 4 and Task 5.
1. Click on the “Basic Cycle” graphic under “Cycle” category as shown in below image and Click on “OK” button.

2. Once we click on “OK” button, “Basic Cycle” Structure will appear as shown in below image.

3. To enter the text in each circle, we have to right click on specific circle and out of appeared options, we have to click on “Edit Text”.

4. With this we can edit Text in each circle and enter the names of our specific tasks in it. In below image I have entered the names as Task 1, Task 2, Task 3, Task 4 and Task 5.

In this way, we can insert SmartArt Graphic design as per our requirement.


Comments
Post a Comment