Dynamic Progress Chart in Excel
In this blog post we will see to create “Dynamic Progress Chart in Excel" from scratch. This chart will help you to present your data in a very dynamic way.

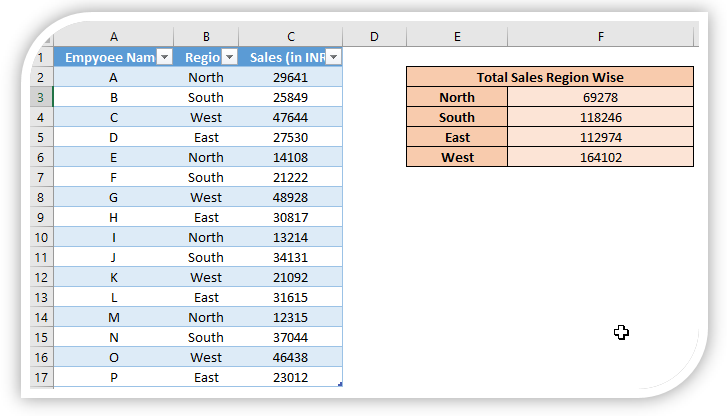
For this we will take a simple example. Let’s say we want to show how many males and females (in percentage) are present in our country. We have used dummy data as shown in below image to create “Dynamic Progress Chart in Excel”. Let us say we have 47% of Males and remaining 53% are Females.

First we will write 47% in front of Male. To calculate the % of females we will use formula (1-Cell address of % of Male).

First we will see the steps to create “Dynamic Progress Chart in Excel” for Male and then by using these steps you have to create “Dynamic Progress Chart in Excel” for Female by your own.
So let us start…
1. First we have to create helper column just beside the cell where we have inserted % for male. Use formula (1-Cell address of % of Male).

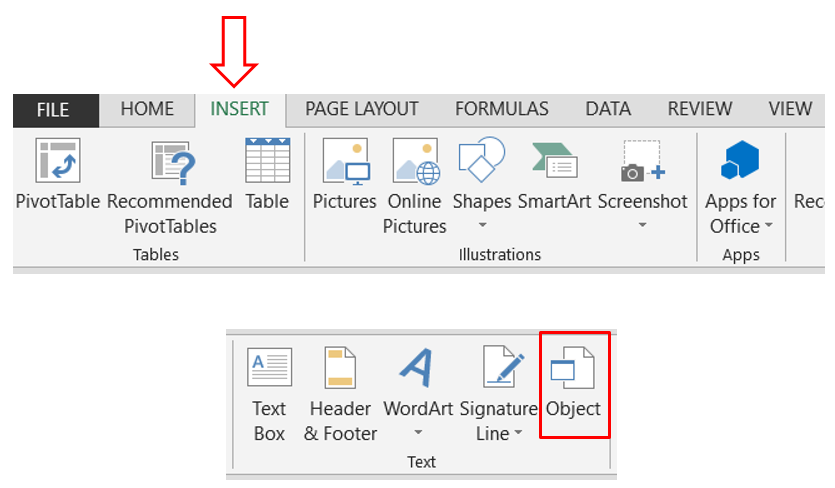
2. Go to Insert Tab. Select “Insert Pie or Doughnut Chart” command and again select “Doughnut Chart”.

3. You will get an empty chart as shown in below image. You may think that something is going wrong as we are getting empty chart. But don’t worry we are getting this chart as empty because we have not selected any data to enter in this chart.
4. Select on this empty chart. You will see “Chart Tools” options enabled in the Ribbon and after this click on “Select Data” command under “Design Tab”.

5. Once you click on “Select Data” command you will get “Select Data Source” window on your screen. You have to press “Add” button under Legend Entries (Series).

6. “Edit Series” Dialog box will now appear on on our excel screen. Enter data as shown below:
a. Series Name: Dummy Series
b. Series Value: 1,1,1,1,1,1,1,1,1,1,1,1,1,1,1,1,1,1 (18 times “1” separated by commas)
Click OK.

7. You will get Doughnut chart as shown in below image.

8. Right Click on any slice of appeared Doughnut Chart and select option “Format Data Series”.

9. Click on “Series Options” and enter the values as given in below image.

10. Under “Fill & Line” options select option “Solid Fill” and Color as “Blue”. (Here you can select any color of your own choice).

11. Select Chart and remove Chart Title and Chart Outline. Now you will see your Doughnut Chart is converted into as below.

12. Again select on above chart. Go to Insert Tab and repeat Step 4 and Step 5. With this we will get “Edit Series” Dialog box on our excel screen. Enter data as shown below:
a. Series Name: Original Series
b. Series Value: Select the data which you have inserted for Male % and the dummy column data which you received in Step no 1. Below image is for your easy reference. Click OK.

13. Your Doughnut chart will now convert similar to as shown in below image.

14. Right Click on outer Doughnut Chart and select “Change Series Chart Type” from list of available options as shown in below image.

15. Select “Secondary Axis Checkbox” for Series Name “Original Data” under “Change Chart Type” window which is on your screen.

16. Select the Chart and under “Format Data Series” enter the values as given in below image.

17. Now select the lower from the Doughnut Chart. Enter below value under “Format Data Point”
a. Under Fill: Select “Solid Fill”
b. Color: White
c. Transparency: 30%

18. Insert a Text Box in the Middle of the Doughnut Chart and apply formula to the textbox as shown in the below image (Basically we have to give cell reference of a cell where we have entered Male %).

19. Select the cell from helper column which we have created in Step no 1. Convert the font color of that cell into “White”. Remove outline of a TextBox and our “Dynamic Progress Chart in Excel” is ready for use. You can try changing the values for male % and your chart will change dynamically.

Now you have to create similar chart for Female %. If you face any difficulty then please write in the comment section.


Comments
Post a Comment