COLUMNS Function in Excel


In this blog post we will learn to about COLUMNS function in excel. COLUMNS function will return number of columns from selected cell range.

Where to find COLUMNS function on Excel Screen:

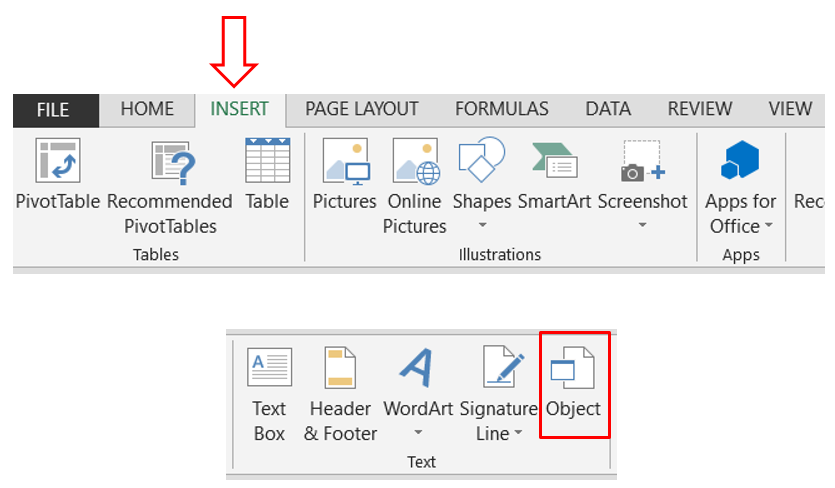
COLUMNS function can be found under “Lookup & Reference” function category under “Formulas” tab and under “Function Library” group as shown in below image:


Once we click on “Lookup & Reference” function category, we can see list of various Lookup & Reference functions available in excel. COLUMNS function is highlighted in blue in below image.


Once we click on COLUMNS option as highlighted above, we will get the function argument dialog box as shown in below image:


Syntax of COLUMNS Function:

The Syntax of COLUMNS function is as below:

=COLUMNS(array)


Arguments of COLUMNS Function:

COLUMNS function takes only one argument.

array: In this argument, we have to provide range of cells from which we want to find out number of columns.

If we do not provide any reference here, then excel will automatically provide column number of a cell where we are currently typing this function.

Example of COLUMNS Function:

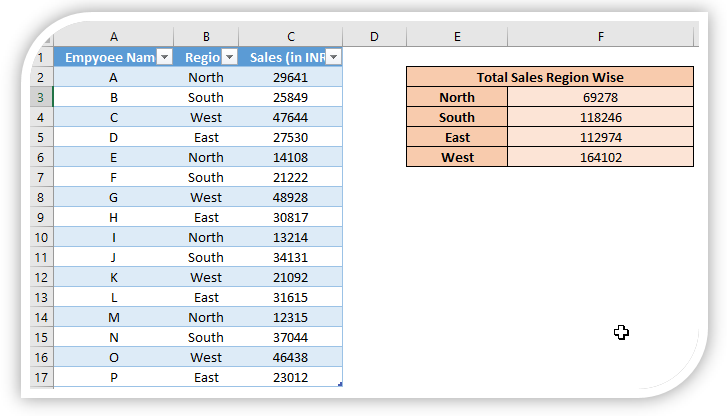
Let’s learn to use COLUMNS function with the below example. We have prepared a dummy data as shown in below screenshot. In this we have highlighted cell range with brown colors. Now, we will find out the numbers of COLUMNS from this brown highlighted cell range.


For this, we have to Select the cell in which we want to find out the COLUMNS number of highlighted cell. In this case we have selected “B1” which is highlighted with light blue color.


In selected cell “B1”, we will apply COLUMNS function as shown in below image where we have provided reference of a brown highlighted cell.


Once we hit enter button, we can see the output out COLUMNS function in below image.


In this way we can use COLUMNS function in excel.

Comments

Related Topics..

Fill Up, Down, Right & Left in Excel

Excel Shortcuts Ctrl A to Ctrl Z

Select all cells highlighted with specific color at a time

How to Remove Duplicate Entries from Multiple Columns in Excel

Excel Pivot Table

Exploring Font Colors and Fill Colors in Excel

Insert Multiple Rows in Excel Based On Cell Value

Doughnut Chart in Excel

Conditional Formatting:Highlighting Above Average and Below Average Values

Bold, Italic and Underline Commands from Font Group