Column Chart in Excel

Pictorial visualization speaks more effectively in data representation. Keeping this in mind in this post we are going to see how we can create “Column Charts in Excel”. Converting data into Column charts will help us to analyze the data quickly.
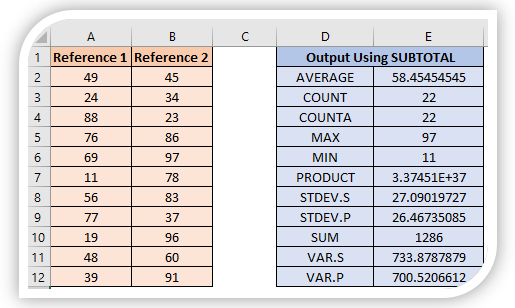
To explain in a very simple way, we have listed salary received by 05 persons. Person A is having salary of Rs. 15000, Person B is having salary of Rs. 13000, Person C is having salary of Rs. 17000, Person D is having salary of Rs. 18000 and Person A is having salary of Rs. 20000.

Now we have to convert this data into Column Chart. This is so easy. Just follow below steps:
1. Select the data which we want to convert into Column Chart.

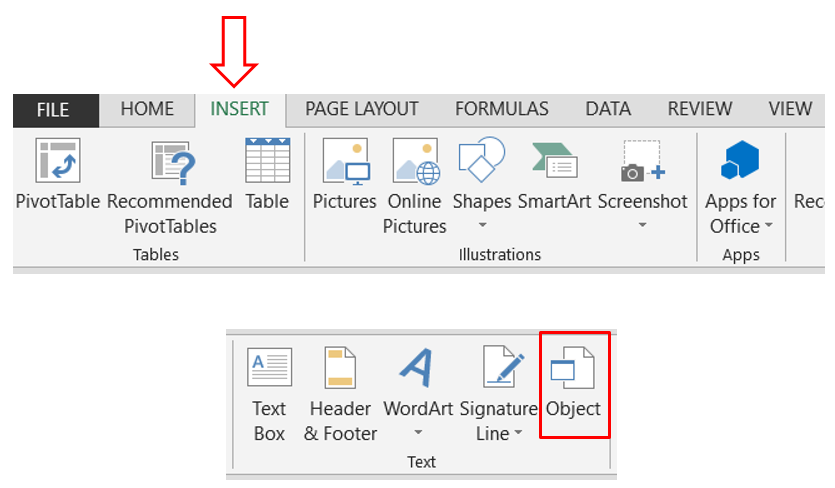
2. Go to Insert Tab, Select "Insert Columns Chart" command under “Charts” group.


3. You will get a window which displays various options of Column Chart. Select “Clustered Column” option under “2-D Column” as shown in below image.

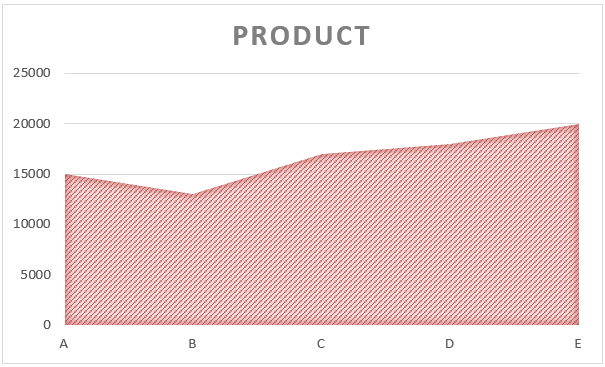
4. You will see "Column Chart" is now ready on your screen.

Changing Table Style:
We can also change the formatting of our chart. Once we click on the existing chart we will see two additional tab on our Ribbon.


There are various Table Style available under Design tab.

Let’s click on “Style 5” which will change our Chart as displayed in below image.

Similarly we can select any of the Table Style of our choice to give special effect to our chart.
Changing Color of Data Bars:
We can also change the colors of data bars. For this we have to select the existing chart. Then click on “Design” tab then under this tab we will click on “Change Color” option.

Once we click on “Change Colors” option, various color options will pop up on screen. As an example we will click on the option “Color 3”.

The chart with “Color 3” will look as shown in below image:

Similarly we can try various Table Styles and Color options to make our chart beautiful.
That’s all about this topic. If you have any queries please write in comment section.


Comments
Post a Comment