Insert Sparklines in Excel

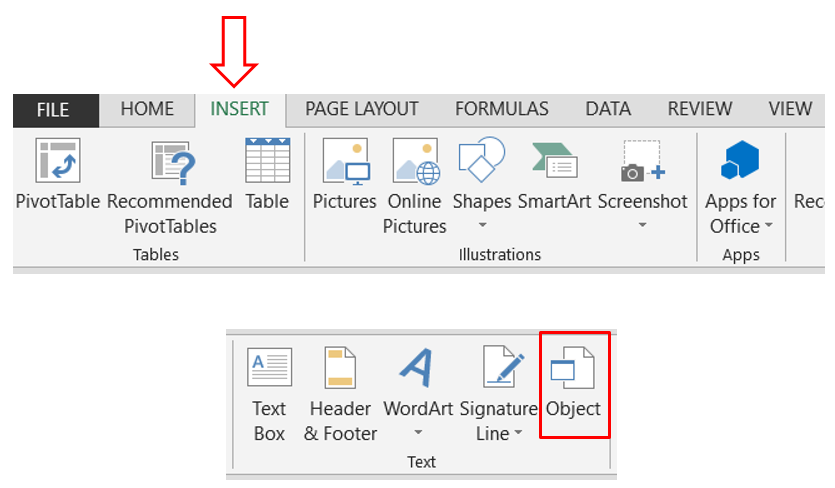
First of all, we should know where we can find the Sparklines command in excel screen. It is available in Insert tab as shown in below image.

There are three types of Sparklines we can insert in excel as listed below:
1. Line: These are similar to Line Chart, the only difference is that we can insert it in a single cell.
2. Column: These are similar to Clustured Column Chart ,the only difference is that we can insert it in a single cell.
3. Win/Loss: These are similar to Column Sparklines but the difference is that magnitude of this Sparklines does not change according to the selected data. It is recommended to use this Win/Loss Sparkline for showing binary output or the data which shows only two types of output such as Win or Loss.
We will now learn to insert all these three types of Sparklines with the help of below data. This is dummy data which we have created specifically for learning this topic. In this data we have listed names of 04 companies A, B, C and D and % of Profit or Loss by these companies from year 2015 to 2020 as shown in below image.

Now, let’s learn to create all the 03 types of Sparklines one by one.
Insert Line Sparklines:
1. Select the data for which we wish to create Line Sparklines. Once we select the data, go to Insert tab and select “Line” under Sparklines group.

2. Once we click on the “Line” Sparklines, one dialog box named as “Create Sparklines” will appear on the excel screen. In this dialog box, we have to provide two inputs:
a. Data Range: This is the cell range on which we have to create Sparklines. If we select the data before clicking on the Line Sparkline, input in this field will reflect automatically.
b. Location Range: This is the cell address of a cell in which we want to display Line Sparklines.
Below image is for your reference.

3. Once we click on “OK” button, we can see that “Line Sparklines” will get added in the cell “H3”.

4. We can also copy paste or drag this Sparklines to the below cells which will help us insert Sparklines for the data in other rows as well.

Insert Column Sparklines:
1. Select the data for which we wish to create Column Sparklines. Once we select the data, go to Insert tab and select “Column” under Sparklines group.

2. Once we click on the “Column” Sparklines, one dialog box named as “Create Sparklines” will appear on the excel screen. In this dialog box, we have to provide two inputs:
a. Data Range: This is the cell range on which we have to create Sparklines. If we select the data before clicking on the Column Sparkline, input in this field will reflect automatically.
b. Location Range: This is the cell address of a cell in which we want to display Column Sparklines.
Below image is for your reference.

3. Once we click on “OK” button, we can see that “Column Sparklines” will get added in the cell “I3”.


Insert Win/Loss Sparklines:
1. Select the data for which we wish to create Win/Loss Sparklines. Once we select the data, go to Insert tab and select “Win/Loss” under Sparklines group.

2. Once we click on the “Win/Loss” Sparklines, one dialog box named as “Create Sparklines” will appear on the excel screen. In this dialog box, we have to provide two inputs:
a. Data Range: This is the cell range on which we have to create Sparklines. If we select the data before clicking on the Win/Loss Sparkline, input in this field will reflect automatically.
b. Location Range: This is the cell address of a cell in which we want to display Win/Loss Sparklines.
Below image is for your reference.

3. Once we click on “OK” button, we can see that “Win/Loss Sparklines” will get added in the cell “J3”.


Deleting Sparklines in Excel:
Deleting Sparklines are not simple as we are deleting the data normally by pressing “delete” key on the keyboard. To delete the Sparklines, follow the below steps:
1. Select all the Sparklines which we wish to delete from excel sheet. Design tab will get enabled when we select the Sparklines (This Design tab will get enabled if and only if we select the Sparklines, otherwise this tab is disabled on Ribbon).

2. Once we select the “Design” tab, we can find “Clear” command as highlighted in below image.
3. We can see one drop down arrow on the right side of this “Clear” command. Click on this drop down button which will show us another two options:
a. Clear Selected Sparklines
b. Clear Selected Sparklines Groups
Out of these two options we have to click on “Clear Selected Sparklines”.


Comments
Post a Comment