Excel Pivot Table
Pivot Table in excel is a very powerful feature which helps us to to organize and summarize the data in very effective manner, that too without using any complex excel formula or functions.
In this blog post we will see how to create Pivot Table in Excel.
Below is the dummy sales data for last three years (2018, 2019 & 2020). In this sales data employees A, B, C & D sales various electronic components like Resistor, Capacitor, Inductor, Diodes & LED in all South, East, North & West region of India.

Creating Pivot Table:
Now we will see how to create Pivot Table in Excel.
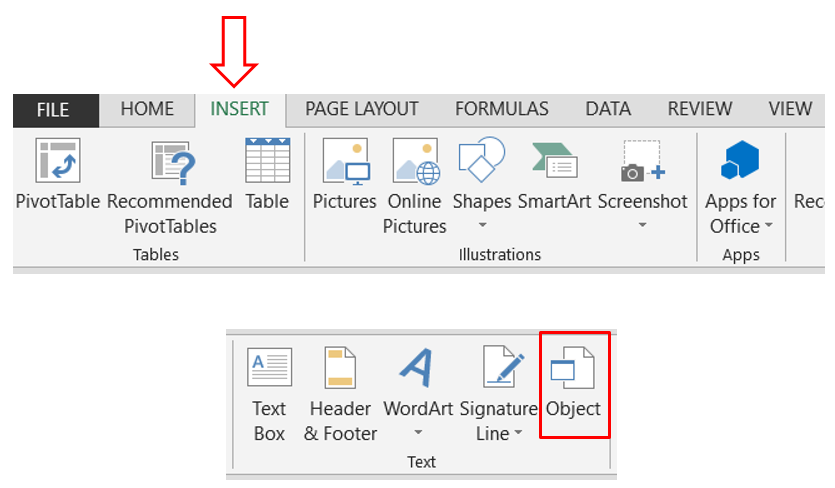
Pivot Table feature is available in Insert Tab. Pivot Table command is available in "Insert Tab" under "Tables Group" as shown in below image.

Once you click on Pivot Table command, “Create Pivot Table” dialog box will appear on screen. This is like as shown in below image.

This “Create Pivot Table” dialog box is very important to create Pivot Table. There are two important options available in this dialog box.
1. Choose Data to Create Pivot Table: This option is important to select data on which we want to create Pivot Table. This data can be in a Cell Range or in Excel Tables.
2. Choose Location for Pivot Table: This option is important to select the location for Pivot Table.
a. To place the Pivot Table in new worksheet, select option “New Worksheet”.
b. To place the Pivot Table in same worksheet, select option “Existing Worksheet”.
If we select this option then we have to provide specific location in same worksheet by providing Cell Address of the cell where we want to place the Pivot Table.

Once we select appropriate options as stated above and click OK button, then we will get blank Pivot Table as shown in below image.
Along with blank Pivot Table we will also get “Pivot Table Fields” on the right side of our excel screen. These “Pivot Table Fields” are nothing but the Headers of our raw data. Hence it is mandatory requirement to create Pivot Table that the raw data must have headers. We just have to drag these Pivot Table Fields into one of the areas
1. Filters: The “Pivot Table Fields” dragged into this area will reflect as a Filters in “Pivot Table”.
2. Rows: The “Pivot Table Fields” dragged into this area will reflect as a Rows in “Pivot Table”.
3. Columns: The “Pivot Table Fields” dragged into this area will reflect as a Columns in “Pivot Table”.
4. Values: The “Pivot Table Fields” dragged into this area will reflect as a Values in “Pivot Table”.

Pivot Table Example 1:
Now we will create our first Pivot Table to generate summary of Regional Total Sales done of our raw data. This is so simple. We just have to drag “Region” field into “Rows” area and “Total Sales INR” field into “Values” area. This selection is shown in below image for easy reference.

After dragging all the fields into respective areas, we will get the Pivot Table for Regional Total Sales as shown in below image. We will get the Total Sale INR for each region.

Pivot Table Example 2:
Now we will see another example to create our second Pivot Table to generate summary of Yearly Total Sales done of our raw data. This is so simple. We just have to drag “Year” field into “Rows” area and “Total Sales INR” field into “Values” area. This selection is shown in below image for easy reference.

After dragging all the fields into respective areas, we will get the Pivot Table for Yearly Total Sales as shown in below image. We will get the Total Sale INR for year.

Advantages of Pivot Table:
1. Pivot Tables is easy to create.2. Pivot Table is very user friendly.
3. No need to use complex formulas and functions to create Pivot Table.
4. Pivot Table easily summarizes big data.
5. Pivot Table can organize and summarize data very quickly.
I hope you will now create Pivot Table very easily. Try and use it in our daily work to reduce your time and energy while working on excel.


Comments
Post a Comment